August 16, 2026
Statistics for Students: A Clear Guide
A student guide to statistics: mean, median, mode, range, variance, standard deviation, and what graphs actually show. Worked examples included.
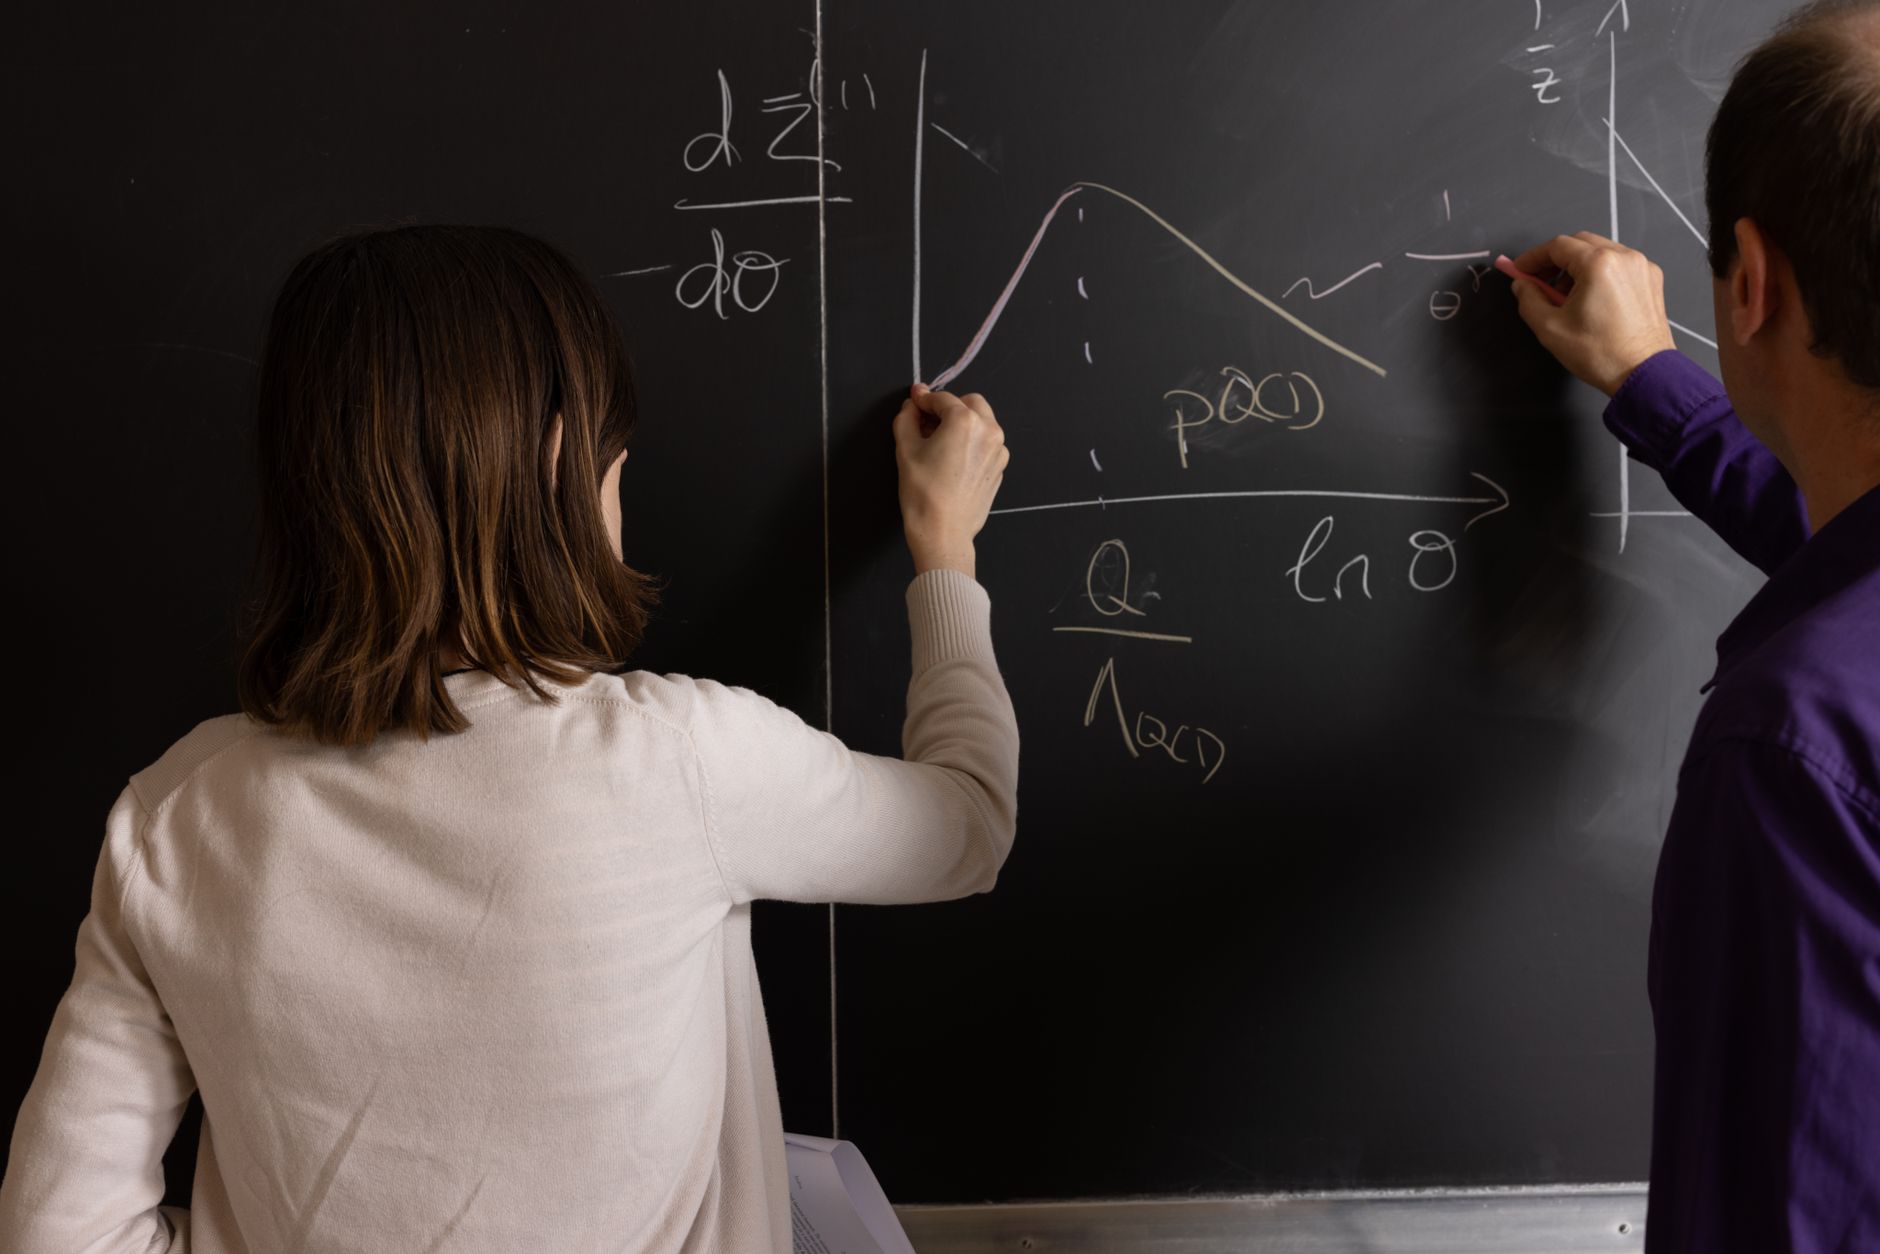
Statistics is the math of data: collecting numbers, summarizing them, and deciding what they mean. The core skills are describing a data set with a few numbers and reading graphs without being fooled. This guide covers the main tools with worked examples you can follow with a pencil.
Statistics at a Glance
| Measure | What it tells you |
|---|---|
| Mean | The average, sum divided by count. |
| Median | The middle value when sorted. |
| Mode | The most frequent value. |
| Range | Largest minus smallest. |
| Variance | Average squared spread from the mean. |
| Standard deviation | Square root of variance, in the data's units. |
Describing the Center
Given the data set 4, 8, 6, 5, 7:
Mean: add them: 4 + 8 + 6 + 5 + 7 = 30. Divide by 5, the count. Mean = 6.
Median: sort the values: 4, 5, 6, 7, 8. The middle is 6. Median = 6.
Mode: the value that appears most often. In this set each appears once, so there is no mode.
The mean is pulled by extreme values. If one score is 100 instead of 8, the mean jumps, but the median stays nearer the middle of most values. That is why news reports often cite the median income rather than the mean, because a few very large incomes pull the average up.
Measuring Spread
Range is the simplest spread measure: largest minus smallest. For 4, 5, 6, 7, 8, the range is 8 - 4 = 4.
Variance measures average squared distance from the mean. For a sample, the formula divides by n minus 1, not n. This correction, known as Bessel's correction, gives a better estimate of the population value from a sample NIST Engineering Statistics Handbook.
Worked example. Data 4, 5, 6, 7, 8, mean 6.
Deviations from mean: -2, -1, 0, 1, 2. Squared: 4, 1, 0, 1, 4. Sum = 10. Sample variance = 10 / (5 - 1) = 10 / 4 = 2.5.
Standard deviation is the square root of variance. Square root of 2.5 is about 1.58. It is in the same units as the data, so it is easier to interpret than variance, which is in squared units.
Reading Graphs
A bar chart compares separate categories. A histogram shows how a numeric variable is distributed across ranges. A pie chart shows parts of a whole. A line graph shows change over time.
Watch for a stretched or compressed axis, which can exaggerate or hide a difference. Always check the numbers on both axes before trusting a visual claim. A graph can be technically accurate and still misleading if the scale is chosen to make a small change look large.
Correlation and Causation
Two variables can move together without one causing the other. Ice cream sales and drowning rates both rise in summer, but buying ice cream does not cause drowning. A third factor, hot weather, drives both. Correlation is a number near 1 or -1 for a strong relationship and near 0 for a weak one; it does not prove cause see correlation overview at Khan Academy.
A common mistake is to read a correlation as a direction. A negative correlation means the variables move in opposite directions, not that the relationship is bad. The sign describes the pattern, not a judgment.
Outliers and Sampling
An outlier is a value far from the rest, such as a 100 on a test where everyone else scored near 70. Outliers pull the mean and inflate the standard deviation, which is why the median is often reported alongside the mean. A single extreme value can change the story a number tells.
Sampling matters too. A mean computed from a small or biased group may not describe the whole population. Larger, randomly chosen samples give statistics that better estimate the true population values. This is why survey methods matter as much as the math itself, and why a single class survey is weak evidence for a broad claim.
Practical Interpretation
When you read a statistic, ask three questions. What is the center, and which measure was used? How spread out is the data, and are outliers present? How was the sample chosen, and who is missing? Those three questions catch most of the ways numbers get misread.
For example, a claim that students study "an average of 3 hours a night" could hide a median of 1 hour with a few heavy studiers pulling the mean up. The spread and the sample tell you more than the single average.
Common Mistakes
- Using the mean when an outlier distorts it; use the median.
- Forgetting n minus 1 in sample variance.
- Reading a graph without checking its axes.
- Assuming correlation means one thing causes the other.
- Treating a small or biased sample as the whole population.
Choosing the Right Measure
Picking the right summary statistic is a skill. Use the mean when the data is roughly symmetric and has no extreme values. Use the median when a few values are far from the rest, because the median ignores their pull. Use the mode for categorical data, such as the most common answer on a survey.
Spread matters as much as center. Two classes can have the same average score but very different experiences: one tight around the mean, one split between high and low. Reporting only the mean hides that story. Standard deviation or range tells you whether the average describes most students or just sits between two groups.
A Worked Example With an Outlier
Take the quiz scores 7, 8, 8, 9, 10, and a 1 from a student who missed the week.
Mean: 7 + 8 + 8 + 9 + 10 + 1 = 43, divided by 6 is about 7.17. Median: sort them as 1, 7, 8, 8, 9, 10. The middle two are 8 and 8, so the median is 8.
The single low score dragged the mean below most students' actual performance. The median tells the truer story of the typical score. This is why teachers often report both, and why you should notice outliers before trusting an average. The NIST handbook treats the choice between n and n minus 1 as a small but real decision when you move from a full population to a sample NIST Engineering Statistics Handbook.
Common Misconceptions
- "The average tells the whole story." The mean hides spread and outliers. Always check the median and standard deviation too.
- "Correlation means one thing causes the other." Two variables can move together because of a third factor.
- "A big sample removes all bias." A large but unrepresentative sample can still mislead.
- "Variance and standard deviation say the same thing." Variance is in squared units; standard deviation returns to the data's units, which makes it readable.
Frequently Asked Questions
What is the difference between mean and median?
The mean is the arithmetic average. The median is the middle value after sorting. The median resists extreme values, so it is often reported alongside the mean.
Why divide by n minus 1 for sample variance?
Dividing by n minus 1 corrects the estimate so it better matches the true population variance. Using n instead tends to underestimate the spread.
What does standard deviation tell me?
It shows how far values typically sit from the mean. A small value means data is clustered; a large one means spread out. Because it uses the data's units, it is easier to read than variance.
Is a higher correlation always stronger?
Stronger relationship means the value is closer to 1 or -1 in absolute terms. A value near 0 means weak relationship. The sign shows direction, not strength.
Does correlation prove causation?
No. Two variables can relate through a third factor or by coincidence. A controlled study is usually needed to claim cause.
When do students learn statistics?
Often in middle school for basics, then again in dedicated high school or college courses. A solid foundation helps across science and social science subjects. Our how to study math guide covers the study habits that carry over.
About the author
Michael R. spent 12 years as a learning specialist and study skills coach. He writes about the evidence behind study techniques, testing claims like spaced repetition and interleaving against actual student outcomes.